Deriving Value from Large Diagrams
Estimated reading time: 5 minutes.
We at Vithanco love drawing diagrams to understand. However, one of the main obstacles with diagrams can be its size. It is not uncommon for us to have diagrams with wy over 100 nodes and 150 edges. If you plan a project with the Benefit Breakdown Structure (BBS) Notation then this represents only a small project. The resulting BBS is quickly becoming messy to look at and the overlapping of edges means that the main diagram is rather confusing.
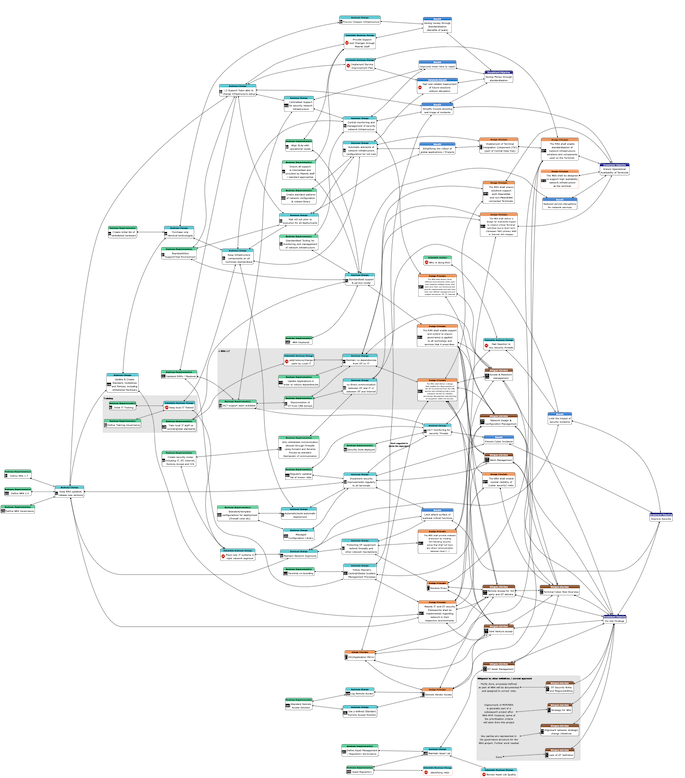
A large Diagram (modified BBS model)
Generally speaking, size can be a limitation to a graph's usefulness by making it difficult to understand the structure. If the graph is too complex and the connections are going crossing many times then the structure is difficult to understand. And if the diagram is not suitable for meaningful communication then it is rather useless. If one large diagram isn't explaining the full story, then we need to provide ways in which to show relevant parts.
How can one manage the full big picture and can still zoom into aspects in Vithanco? Or to ask metaphorically: How can one see the forest/woods and the trees? This post provides some answers.
Cluster and Cluster Folding
The first approach includes an element of diagrams that are sometimes overlooked: Clusters. A Cluster is a part of the diagram (a subgraph) that is drawn together, is visually emphasised with a different background and has a name.
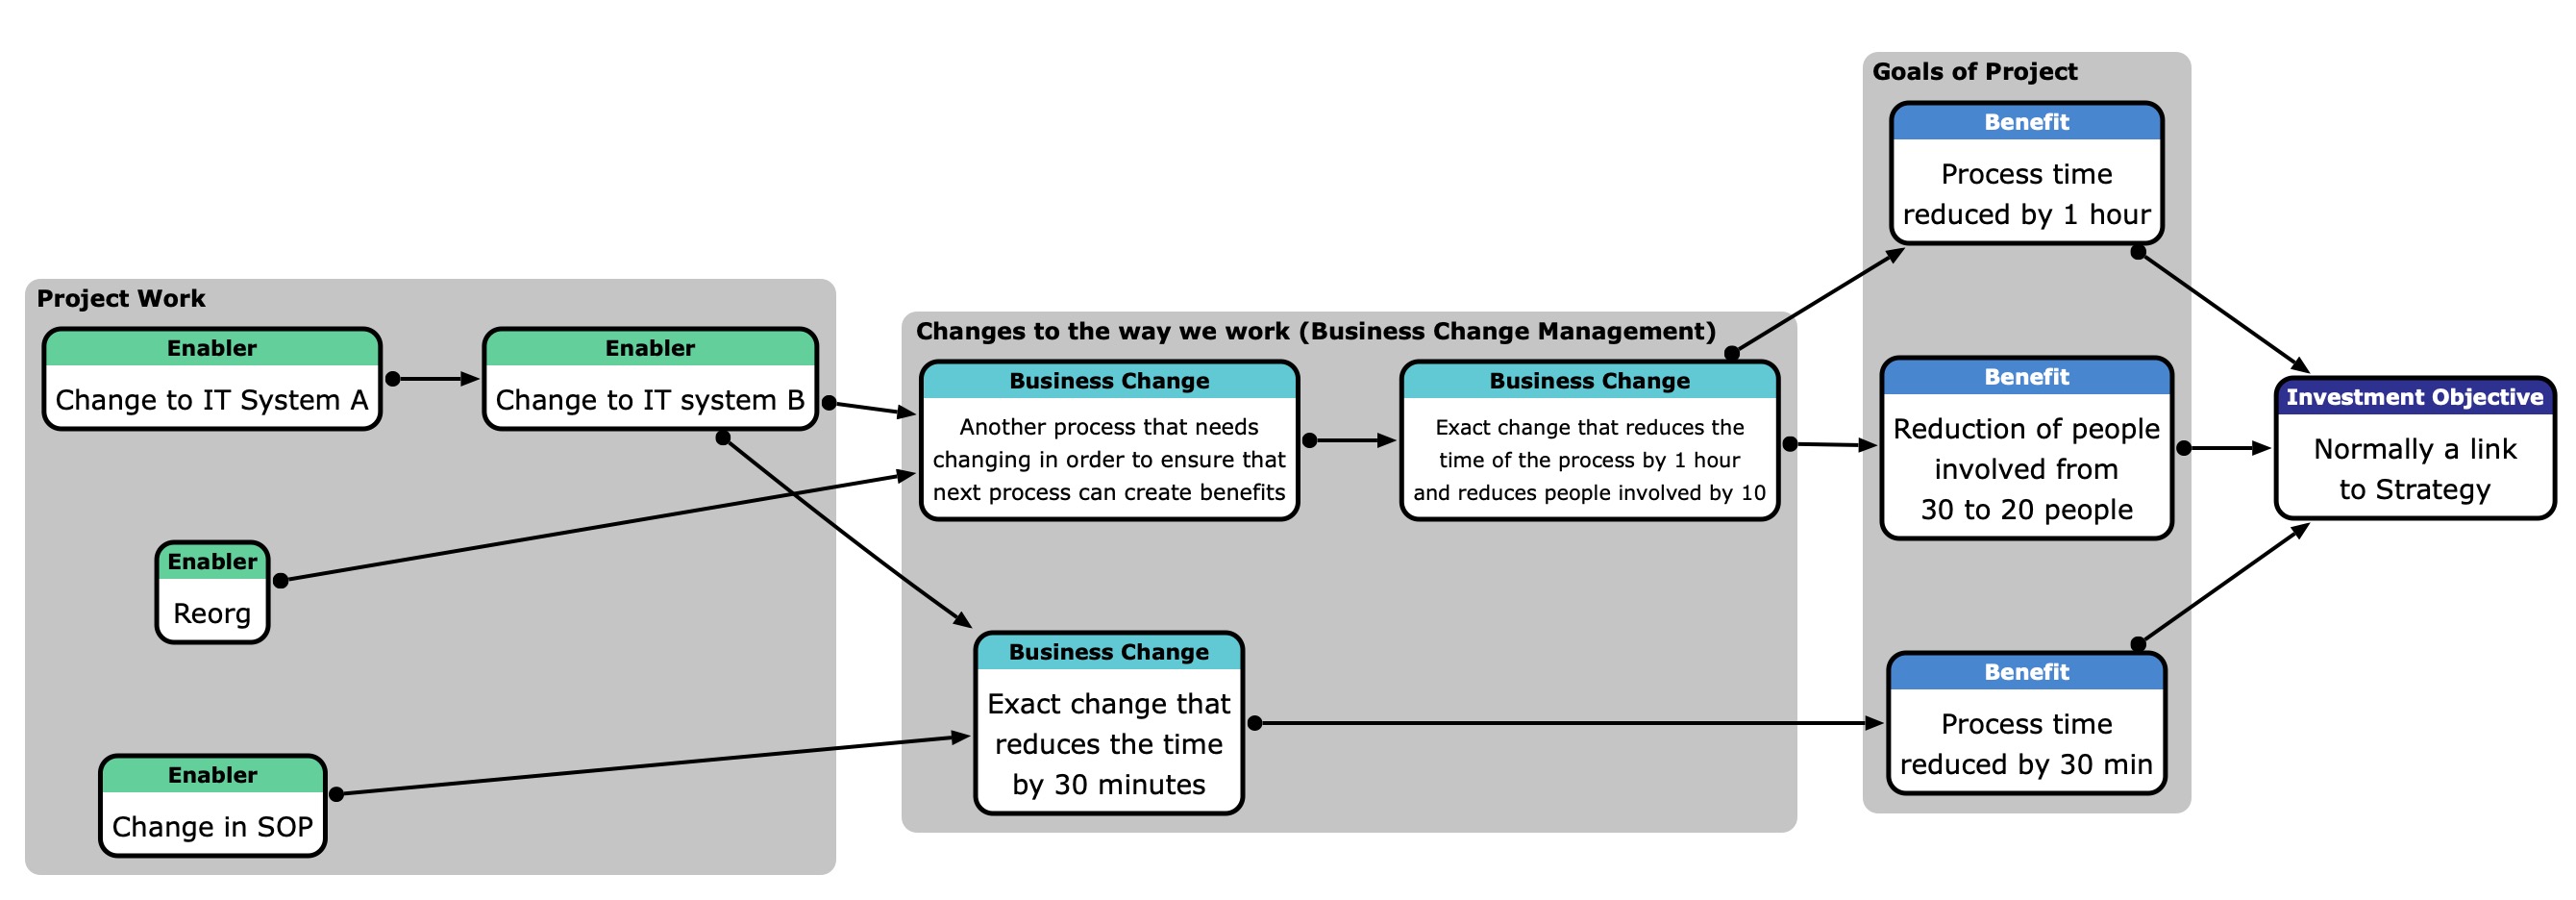
The above diagram has 3 clusters, each one drawn around the different node types. However, if you fold each cluster (and ensure that you use a strict graph) then you get something similar to the one below. The nodes within each cluster are "hidden" away, but can easily be retrieved by a mouse click (use the folding map symbol button).
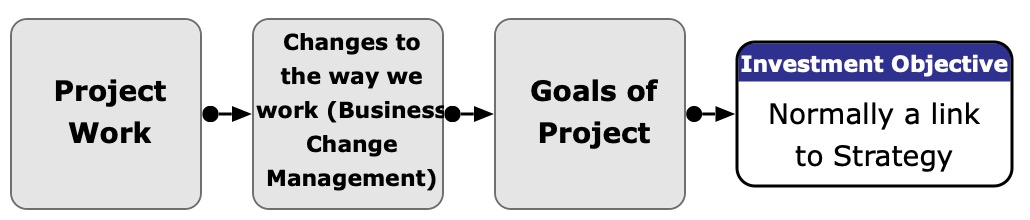
So, the first way to keep the overview: create folders and hide some areas that you currently don't need. Clusters are generally a good idea to make a diagram better understandable.
Focus View
Working on a diagram requires changing perspective. Sometimes you need to see the whole and sometimes you need to see only a small part and focus on it. It can be a few nodes, it can be a predecessor Tree. And it is simple with Vithanco to switch perspectives. Select the nodes that you need and click the "Focus on Selection" toolbar button. The main diagram will be replaced with the subgraph that contains only the selected nodes. In the top right corner will be a "return to full graph" button. You can manipulate the subgraph in the same way as the full graph and changes to the subgraph will be applied to the full graph too.
Within the Focus on Selection View is it easy to review a specific part. Nodes that otherwise might be spread across a big diagram will be located together and the structure can be reviewed. This became such a standard way of graph manipulation that we added shortcuts for selecting nodes easier.
- mouse click: select/deselect clicked node
- [Shift] + mouse click: select predecessor tree
- [Shift] + [Opt/Alt] + mouse click: select successor tree
- [Opt/Alt] + mouse click in Node Statistics: select/deselect all Nodes of the clicked Node Type
Especially the last one allows us to quickly create views with the right content. Thinking of the BBS structure mentioned above. Clicking on "Investment Objectives" and "Benefits", and then choosing "Focus on Selection" allows us to see the value proposition of an initiative even if the diagram itself became big.
The second way of keeping the overview: whenever you need to look at some parts in more detail use the focus view.
Reports
Reporting is another way of digesting a large diagram. Reporting allows us to slice and dice the information and make it digestible. The right report depends on notation and the use and Vithanco's reporting is accordingly flexible. This is how it works.
For a BBS diagram, we normally look at the benefits of a project/change initiative and how to enable each benefit. It is often the right way to deliver one benefit after the other instead of delivering many at once. So, the natural way is to select a benefit and its predecessor tree and to enable the benefit through the delivery of benefits. But how to choose the next benefit? Here, the report becomes useful. 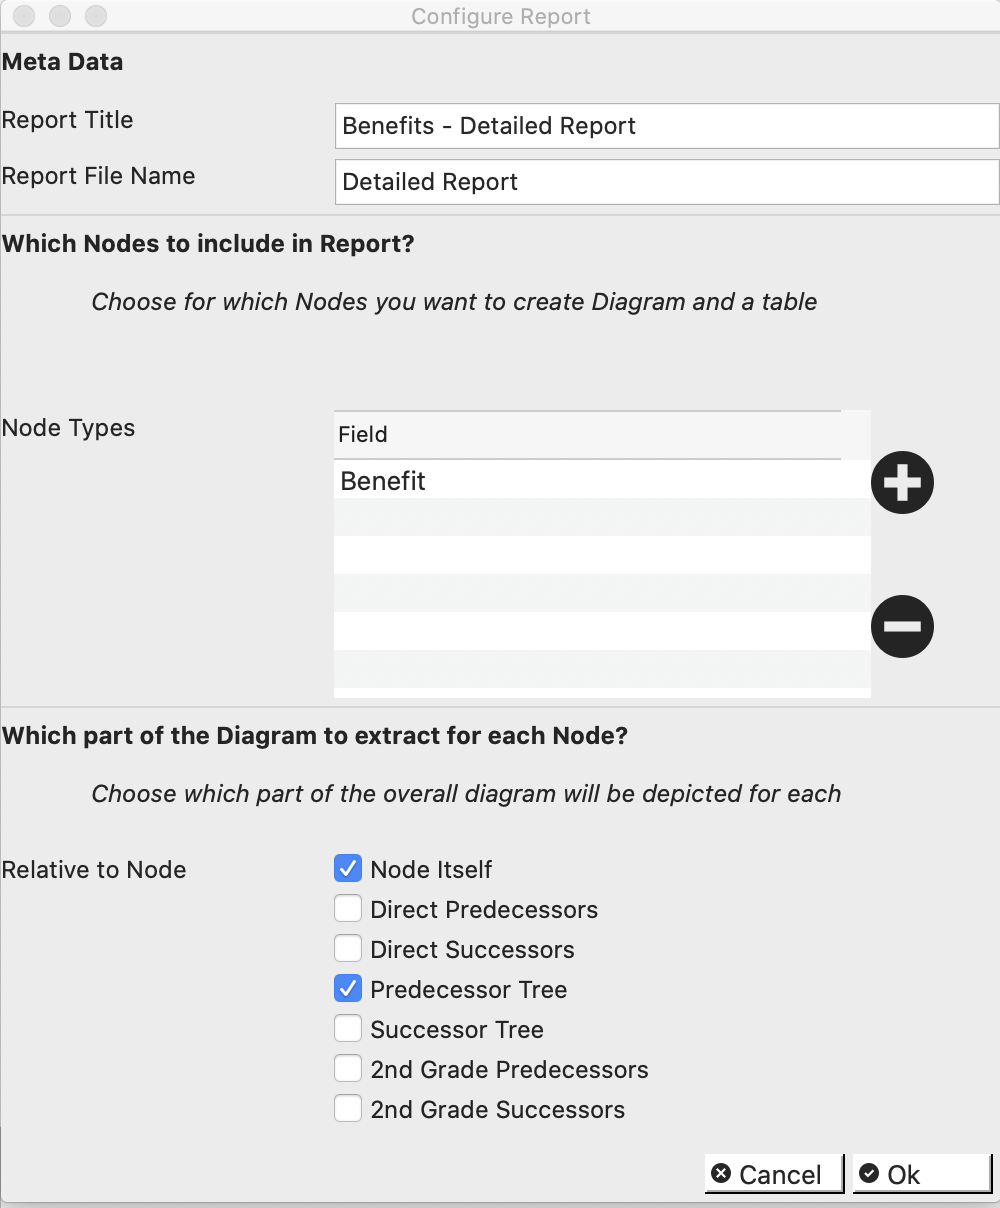
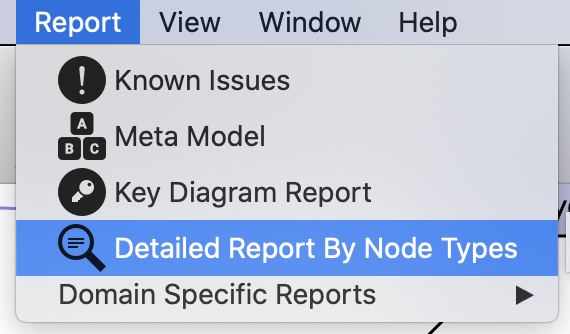
Choose the Report Menu and select "Detailed Report By Node Types". In the following dialog choose "Benefit" as the Node Types and choose "Node Itself" and "Predecessor Tree". Clicking Ok will create the report. That is a document that contains a dedicated diagram for each benefit. Each benefit diagram will contain the predecessor tree for that benefit alone.
The resulting Report will be created as a Markdown (.md) document. Choose an appropriate tool to convert Markdown to other formats if needed. Share the document with everyone interested. They won't need Vithanco to digest the report.
The third way of working with large diagrams: create useful reports to see each facet.
Table View
Another useful way to handle complexity is to use a different way to present the information. Vithanco offers a table view to ignore the edges and focus on the nodes alone. Each Node becomes a row in a table. Use this tool to quickly change node texts, etc.
The Table View will present the selected nodes only. If no node is selected then it will present all nodes. As the selection of specific Node Types can happen quickly through the Node Statistics (see above, [Opt/Alt] + mouse click selects/deselects all Nodes of the clicked Node Type) the Table View can be used to quickly review all nodes of particular Node Types.
The fourth way to switch between the whole and details is a different presentation of the diagram: a table.
Bonus: Automatic Highlighting of Connected Nodes
Especially when the degree of the Nodes (vertexes) is high the resulting diagram will have overlapping edges. Vithanco highlights the connected Nodes for each Node/Edge when you move the mouse, allowing you to follow the particular edges easily.
Conclusion
Vithanco provides tools that make it possible to "zoom" into details and out again.
- Cluster Folding
- Focus View
- Reports
- Table View
Use these tools to deal with large diagrams.