Causal Loop Diagram Notation
Estimated reading time: 3 minutes.
Why use Causal Loop Diagrams (CLDs)?
Causal Loop Diagrams (CLDs) are a way to capture systems, analyse them and plan to influence them. CLDs explain the long-term behaviour of systems which is otherwise difficult to understand based on if you only look at the current as-is snapshot.
CLDs describe systems via "stocks" (nodes) and (edges). Much of the day-to-day world can be accurately described as such a system. Let's look at a simple example: A bank account and the interest earned.

- The amount of the Bank Balance (a stock) will affect the amount of the Earned Interest (another stock), as represented by the connection, pointing from Bank Balance to Earned Interest.
- Since an increase in Bank balance increases Earned Interest, this link is of the same kind, meaning more results in more. Interestingly, this even works for a negative amount in your bank account.
- The Earned interest gets added to the Bank balance, also a link of the same kind, represented by the bottom connection.
- The causal effect between these nodes forms a positive reinforcing loop, represented by the icon in the middle containing an "R" and showing the loop direction (clockwise).
This system is only a part of a bigger system that would include salary payments and withdrawals to live. But if left alone, the reinforcing loop points out that this system would lead to an uninterrupted growth of the two stocks involved.
A CLD is very useful to identify the loops that affect the systems' behaviour. Especially the separation between balancing and reinforcing loops provides meaningful insights into a system's behaviour as shown in the following table.
| Loop Type | Description | Behaviour |
|---|---|---|
| Balancing | Balancing loops have an odd number of opposite connections (negative links). | Balancing loops are associated with reaching a plateau. |
| Reinforcing | Reinforcing loops have an even number of opposite connections (negative links, | please note that zero also is even). Reinforcing loops are associated with exponential increases/decreases. |
CLD Notation Description
CLDs have only one single node type. Add more node types if you want to differentiate further. The easiest way is described here.

| Node Type | Description | Successors |
|---|---|---|
| Stock | Everything is a stock in a CLD. Stock amounts can change over time, based on incoming connections. Currently this is not evaluated/simulated by Vithanco. | Stock |
The CLD Notation has 2 different Edge Types.
| Edge Type | Description | Marked with |
|---|---|---|
| Systems Thinking - Same (Positive causal Link) | Positive causal link means that the two nodes change in the same direction, i.e. if the node in which the link starts decreases, the other node also decreases. Similarly, if the node in which the link starts increases, the other node increases. | "s" (as same) |
| Systems Thinking - Opposite (Negative causal Link) | Negative causal link means that the two nodes change in opposite directions, i.e. if the node in which the link starts increases, then the other node decreases, and vice versa. | "o" (as opposite) |
The CLD Notation introduces a new visual element, the loop indicator which is presented for each automatically identified loop.
A loop can either be clockwise or counter-clockwise. In addition, there exists balancing and reinforcing loops. Together these two types result in one of four different loop indicators.
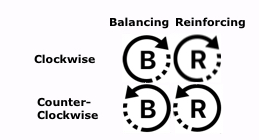
One of these is created for every new loop. If you move your mouse over the loop indicator then it will be highlighted, together with the corresponding loop.
Background on CLDs
Extensive research was done regarding systems (see as a starting point: Donella Meadows' Thinking in Systems) as part of a body of knowledge called systems thinking. One interesting way of accessing systems thinking knowledge is by learning about the so-called archetypes.